Data Analysis for Accountants: Getting Started
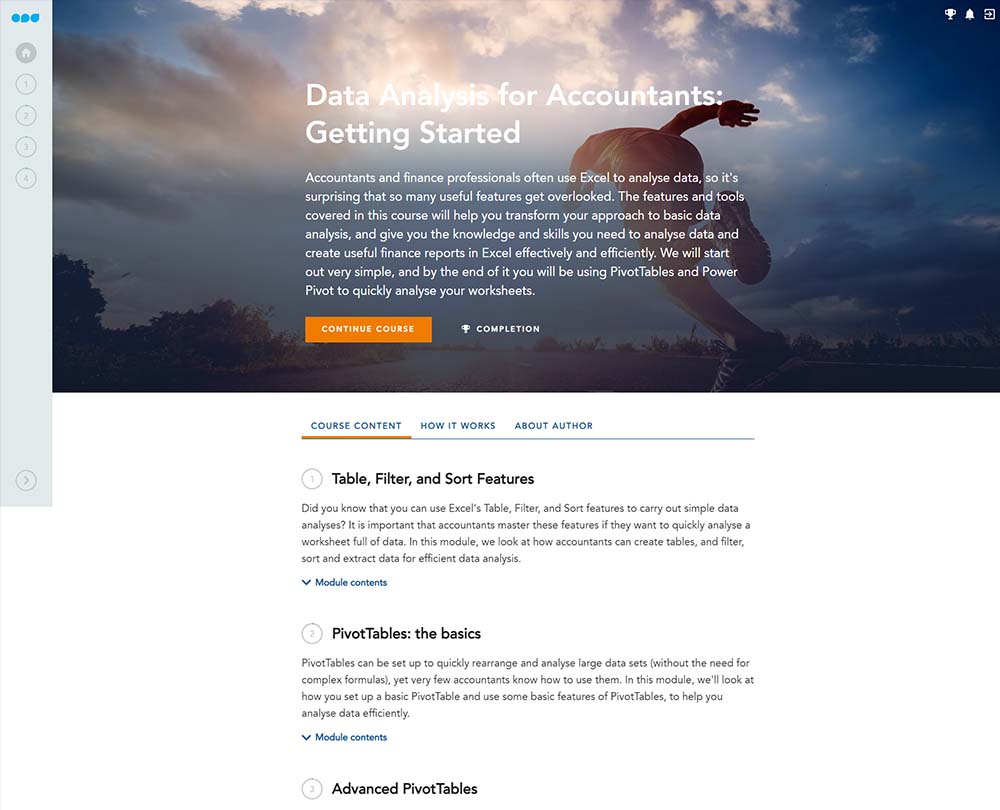
As a finance professional you use Excel to analyse data, but how often do you overlook Excel's useful features? This course looks at basic and advanced features of Excel's PivotTable tool as well as PowerPivot and Data Analysis Expressions (DAX).
This course is not currently available
This course will enable you to
- Create tables, filter, sort and extract data for efficient data analysis
- Set up a pivot table and apply summaries and calculations
- Create and modify a pivot chart and use the GETPIVOTDATA function
- Analyse data across multiple tables or data sets from different data sources using Data Analysis Expressions (DAX)
About the course
As a finance professional you will use Excel to analyse data, but how often do you overlook Excel's useful features? You may be familiar with creating tables, and filtering and sorting your data, but what more could you be doing to get more insight from your data?
This course looks at both basic and advanced features of Excel's PivotTable tool, which can be used to rearrange and summarise huge data sets without the need for complex formulas. You will also explore PowerPivot, one of Excel's most popular Power Tools. Equipped with its own language, Power Pivot enables you to analyse data across multiple tables or data sets, from different data sources.
Look inside
Contents
- Table, Filter, and Sort Features
- Using tables
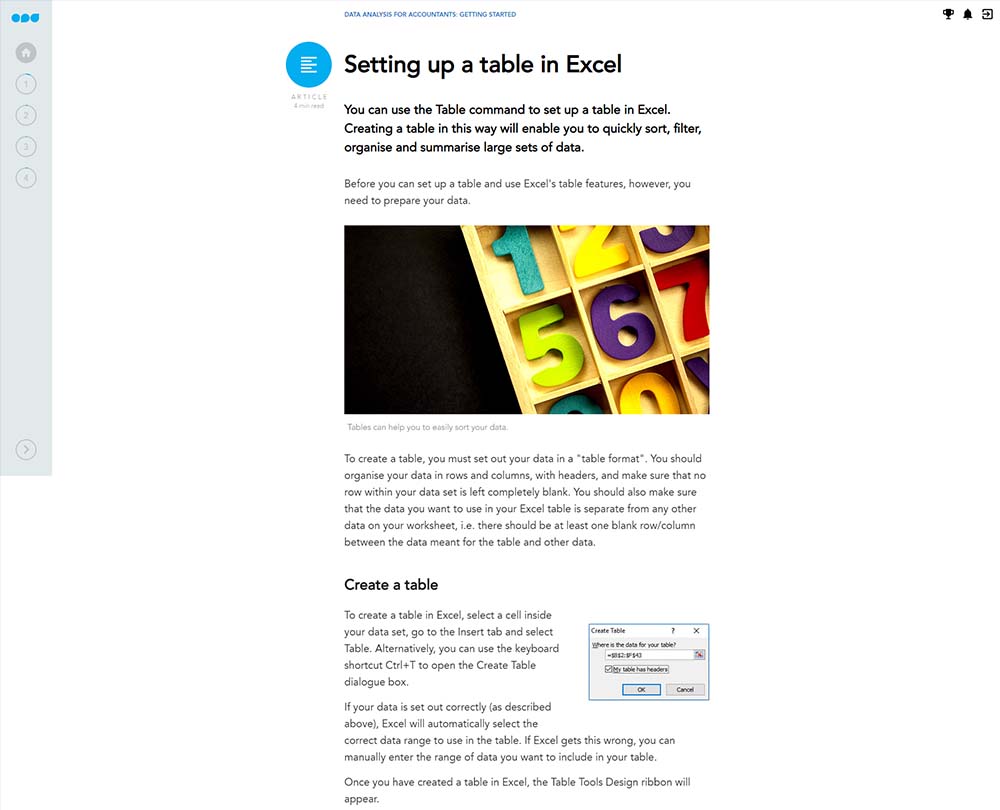
- Setting up a table in Excel
- Tables: an example
- How to filter data
- Filtering data
- Sorting data and applying conditional formatting
- Sorting it out
- The benefits of using tables
- Extracting data based on a single criterion
- Extracting data based on multiple criteria
- Extracting using multiple criteria
- PivotTables: the basics
- Introducing PivotTables
- Understanding PivotTables
- How to create a PivotTable
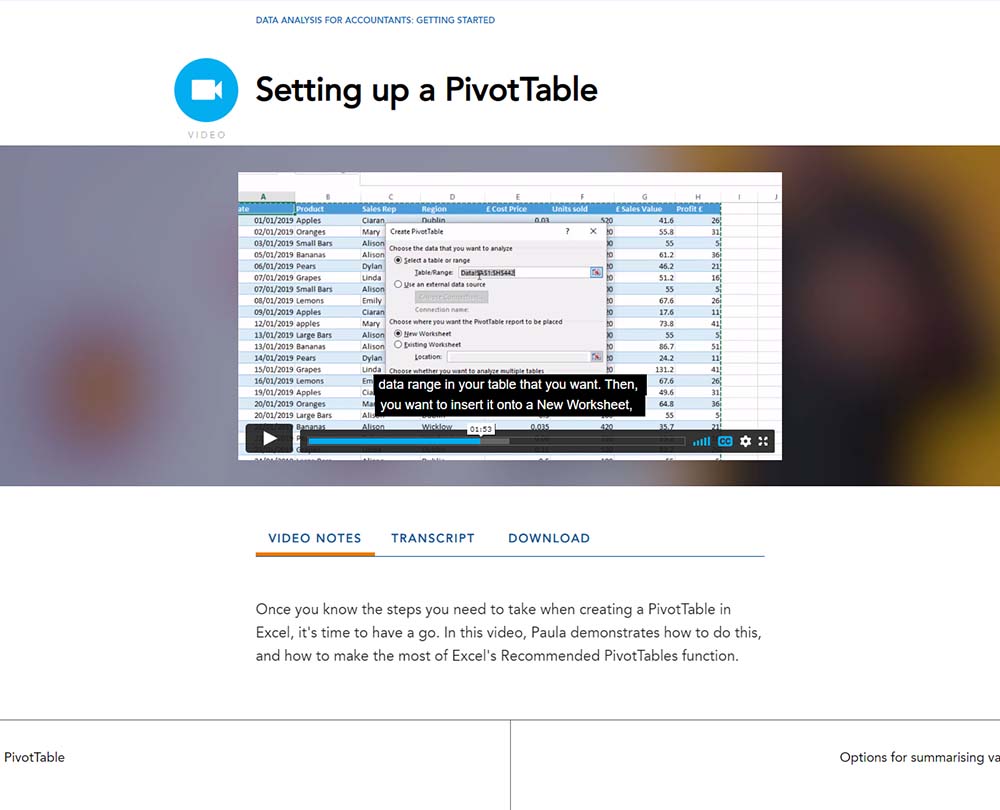
- Setting up a PivotTable
- Options for summarising values in a PivotTable
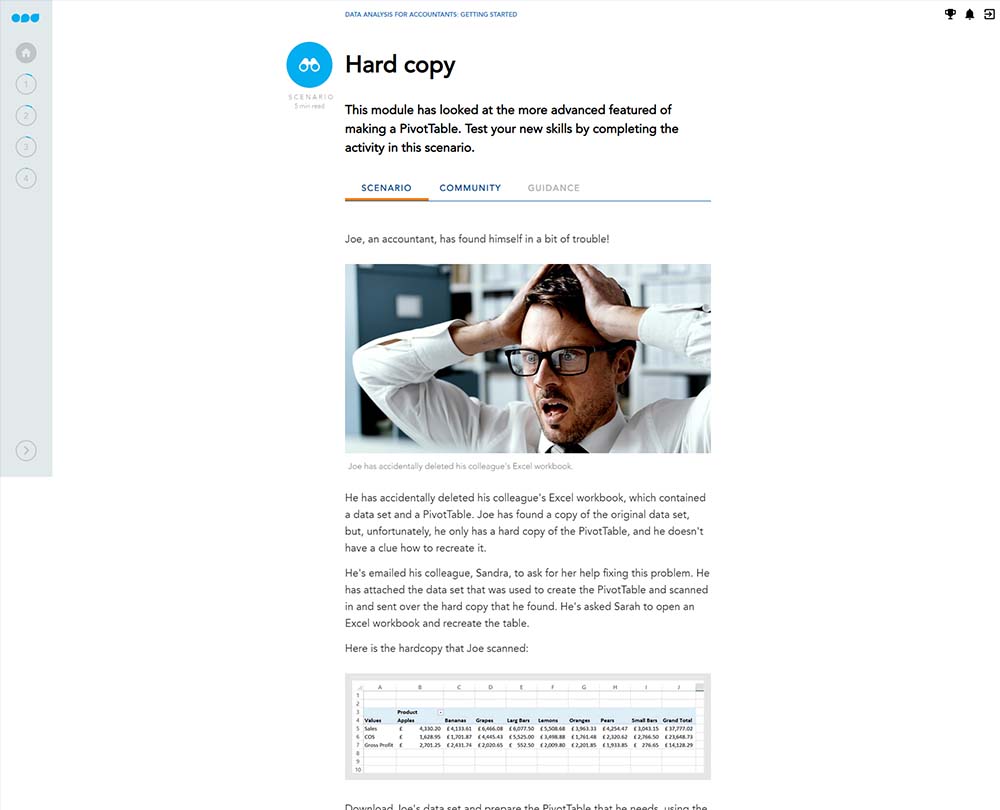
- Adding calculations to a PivotTable
- Different calculations in PivotTable value fields
- Grouping data in a PivotTable
- Grouping and ungrouping data
- Applying a filter to a PivotTable
- Using filters and report filter pages
- Advanced PivotTables
- Introducing advanced PivotTables
- Adding a calculated field to a PivotTable
- Creating a calculated field
- Inserting a calculated item
- Formatting a PivotTable
- Number formatting in PivotTables
- The GETPIVOTDATA function
- Adding slicers and timelines to a PivotTable
- Slicers and timelines
- Understanding report layouts
- Creating a PivotChart
- Using PivotCharts
- Power Pivot
- Introducing Power Pivot
- Understanding Power Pivot
- Power Pivot orientation
- Creating a linked table
- Inserting PivotTables
- Linking data tables
- Relationships between tables
- Setting up relationships
- Setting up a table in Power Pivot
- Adding calculations
- Explaining DAX
How it works
Reviews
You might also like
Take a look at some of our bestselling courses
This course is not currently available. To find out more, please get in touch.

